Portfolio
The Portfolio report is your investment performance dashboard — tracking returns, volatility, and composition across all your investment accounts in real time.
Summary Cards
Four cards run across the top of the Portfolio report, giving you an immediate read on your investment health.
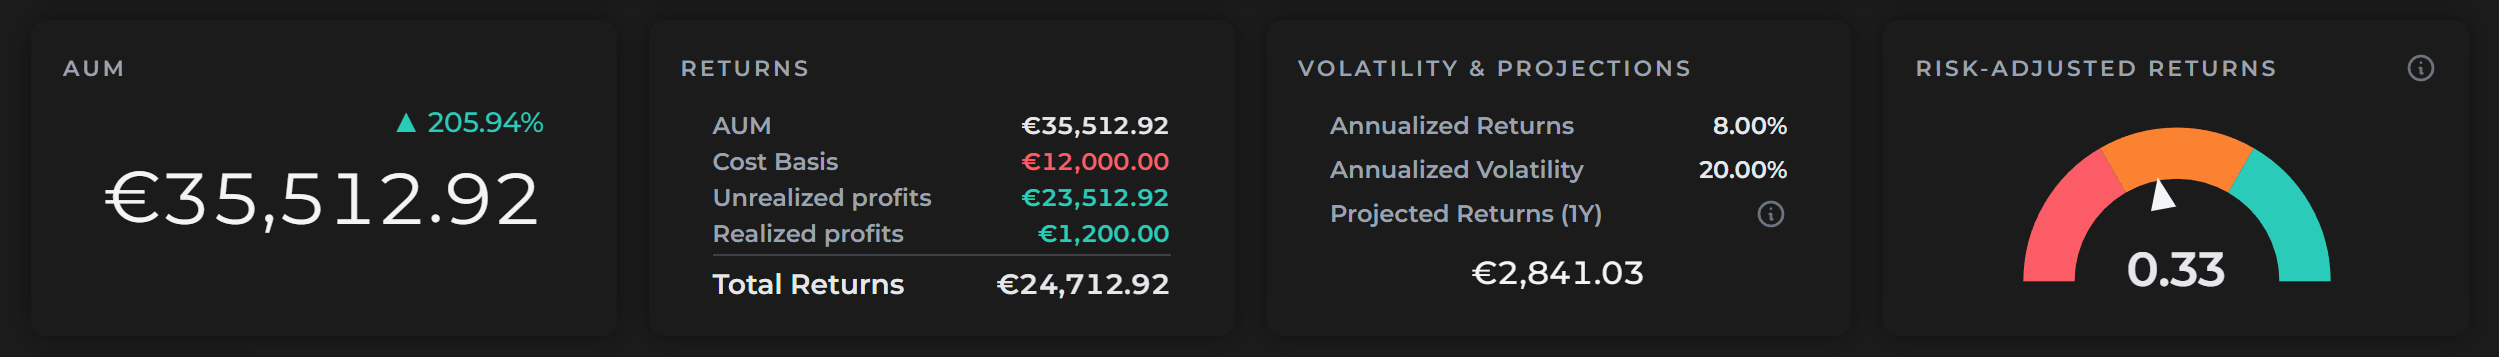
AUM
Assets Under Management — the total real-time value of everything held in your investment accounts, converted to your primary currency. A percentage change indicator shows how your portfolio has moved since you first started tracking.
Returns
A breakdown of where your returns come from:
| Metric | What it means |
|---|---|
| AUM | Current total portfolio value |
| Cost Basis | What you originally paid — either the purchase price of each asset, or the value of the account when it was first added to Finzen |
| Unrealized Profit | The gain or loss on positions you still hold |
| Realized Profit | Gains locked in from sell transactions |
| Total Returns | The combined absolute sum of unrealized and realized profits |
Realized profits are calculated automatically whenever you record a sell transaction on an account with a tracked cost basis. No manual calculation required.
Volatility & Projections
Shows how your portfolio has behaved historically and where it might go. Keep in mind that past results do not guarantee future performance. This is simply an estimate using a normal distribution and your portfolio's volatility and returns. It may take a long time to build accurate data.
- Annualized Returns — your average yearly return rate
- Annualized Volatility — how much your portfolio value swings from year to year
- Projections — three forward-looking estimates based on your historical returns and volatility:
| Projection | Percentile | Interpretation |
|---|---|---|
| Low | 20th | A weaker-than-average outcome |
| Mid | 50th | The median expected outcome |
| High | 80th | A stronger-than-average outcome |
On smaller screens, only the Mid projection (50th percentile) is shown to keep the card readable.
Risk-Adjusted Returns
A gauge that measures how efficiently your portfolio generates returns relative to the risk it takes on. Finzen uses the Sharpe ratio — one of the most widely used metrics in portfolio analysis:
Sharpe = (Annualized Return − Risk-Free Rate) / Annualized Volatility
Finzen uses a 1.5% risk-free rate and derives the annualized return using the money-weighted XIRR method, which accounts for the actual timing of your contributions and withdrawals. Volatility is calculated from the last 365 days of daily returns.
The number displayed in the center of the gauge tells the story:
| Score | What it means |
|---|---|
| Above 1 | Good — strong returns relative to the risk taken |
| 0 to 1 | Weak — returns exist, but the risk-to-reward ratio could be optimized |
| Below 0 | Poor — the risks currently outweigh the returns |
A higher score doesn't always require chasing higher returns. Reducing portfolio volatility through diversification can be just as effective at improving your risk-adjusted performance.
Performance
The default view when you open the Portfolio report. It shows your investment results over time through a combined chart and a detailed asset sidebar.
The chart
For each month, a bar shows the monthly P&L — green for a profitable month, red for a losing one. A cumulative P&L line overlays the bars, giving you the running total of gains and losses since tracking began.
Use the toggle to change the time range: 3 months, 1 year, or Max.
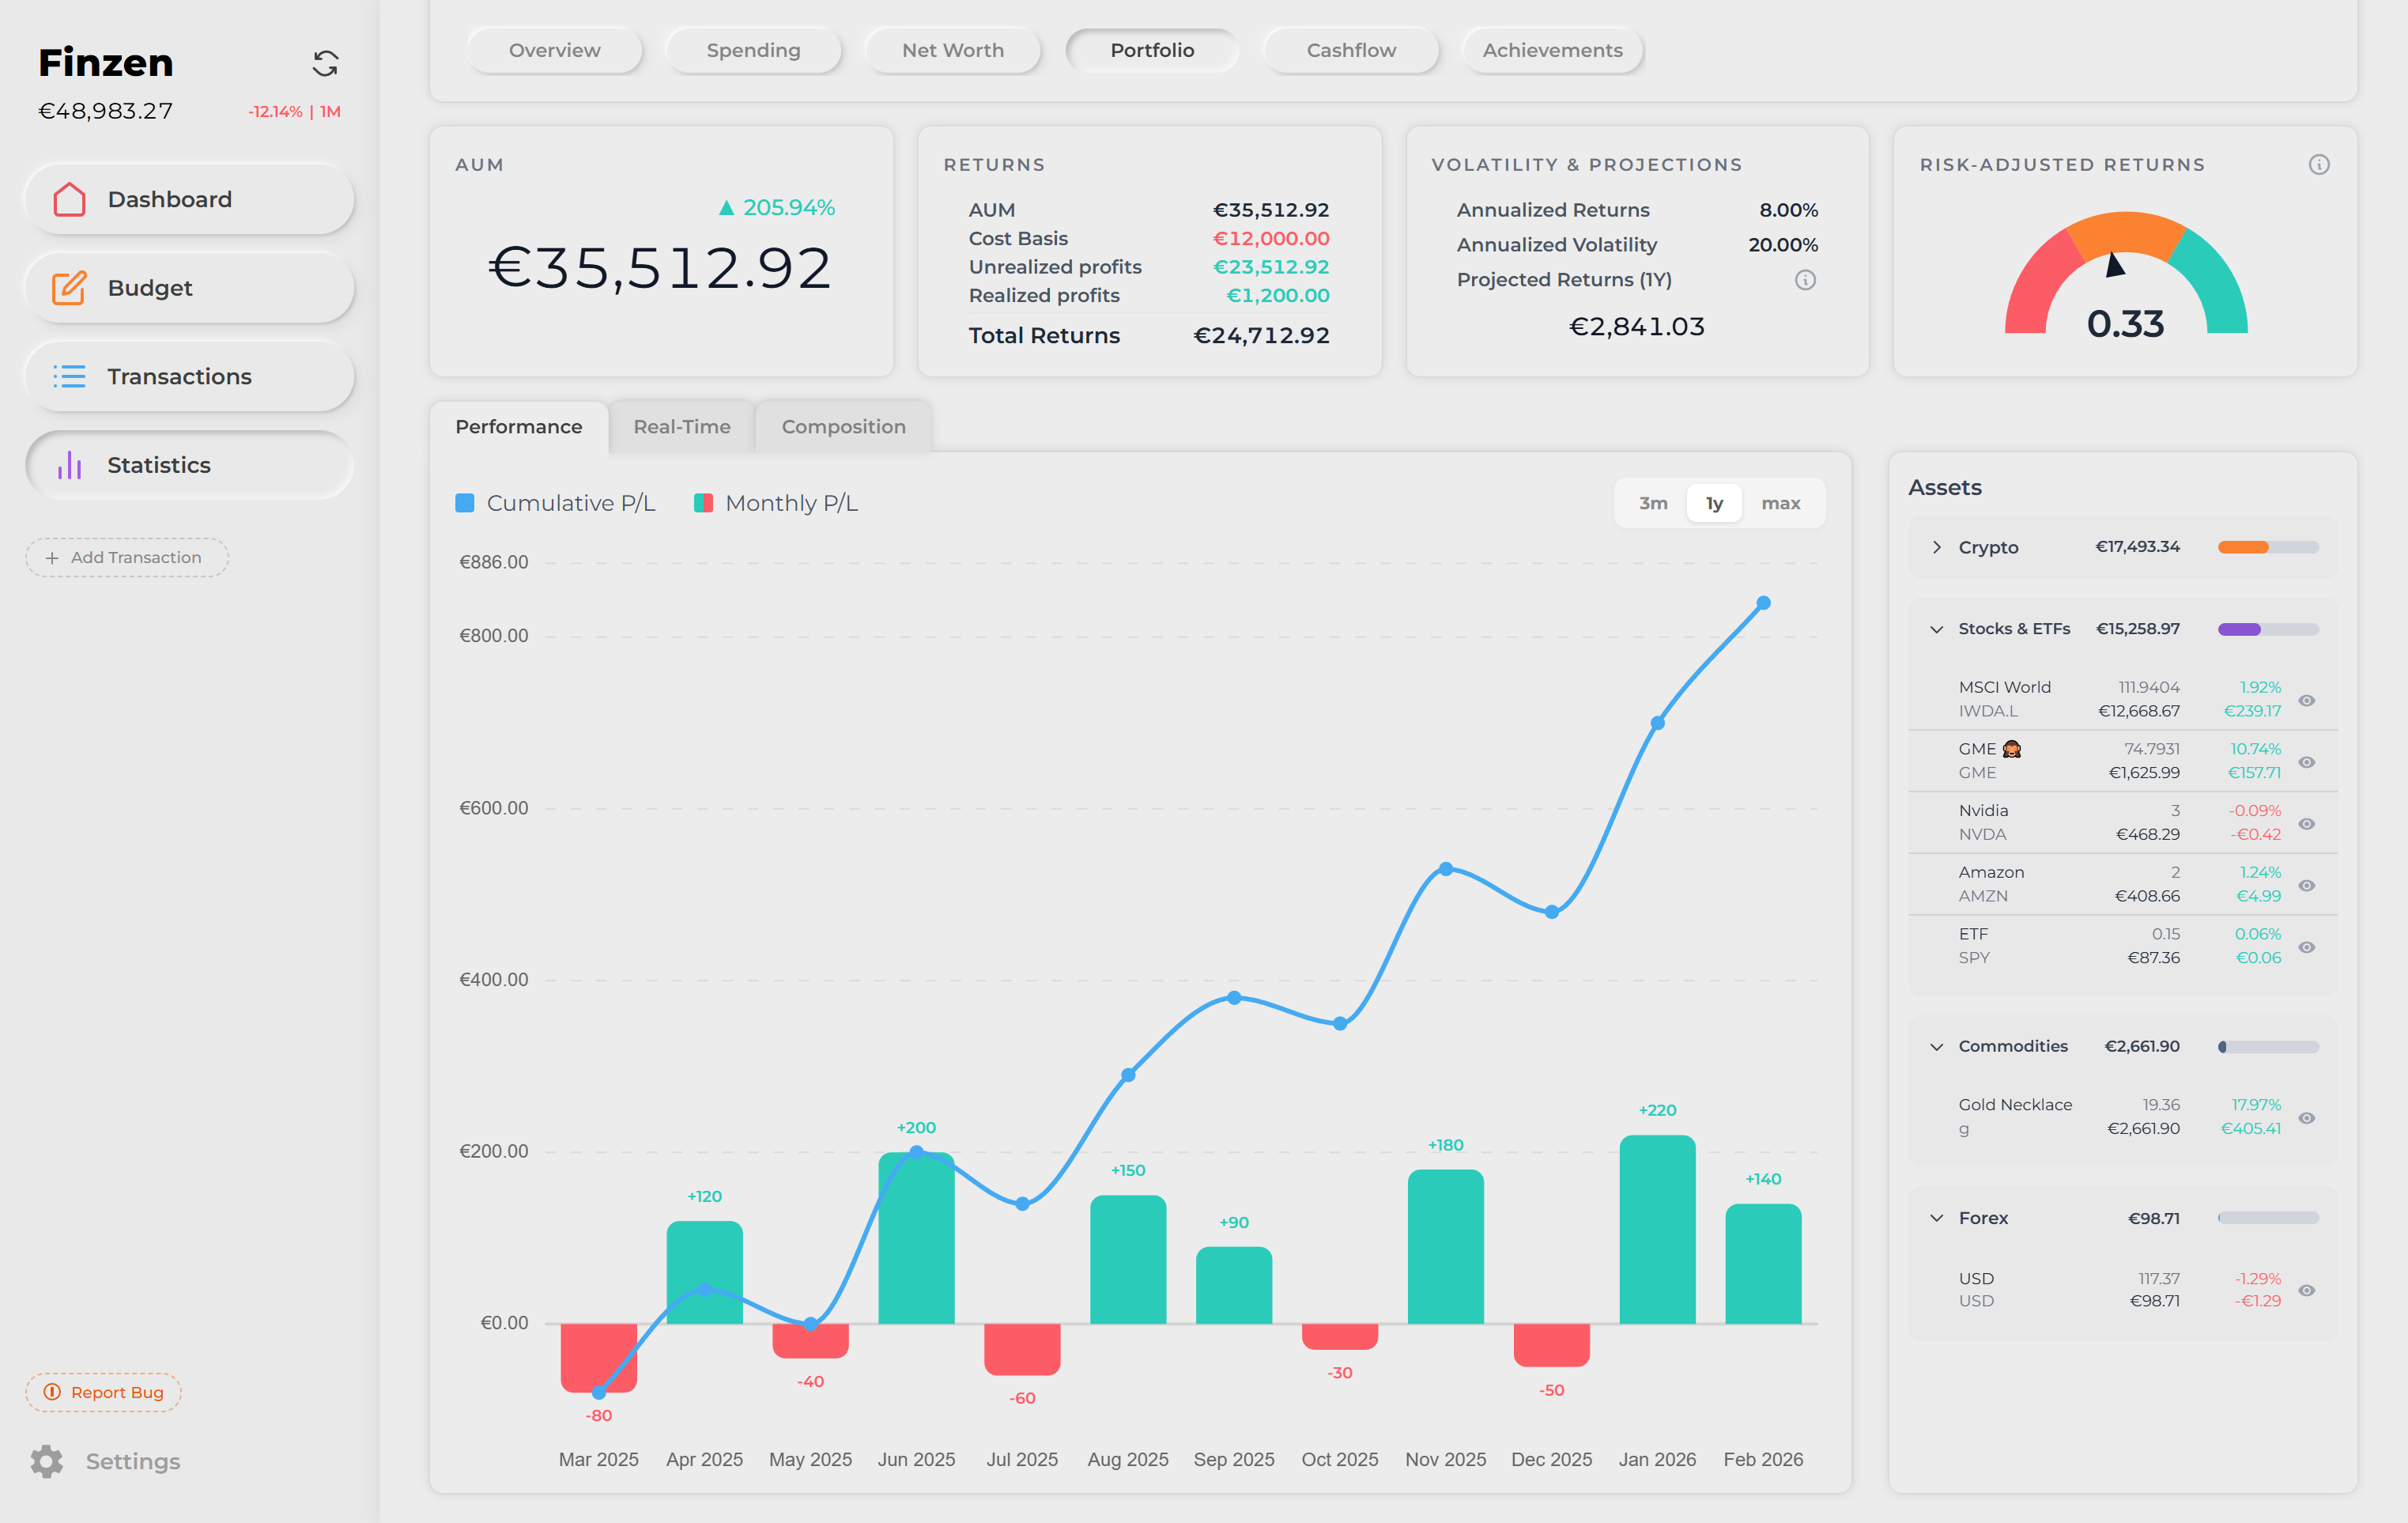
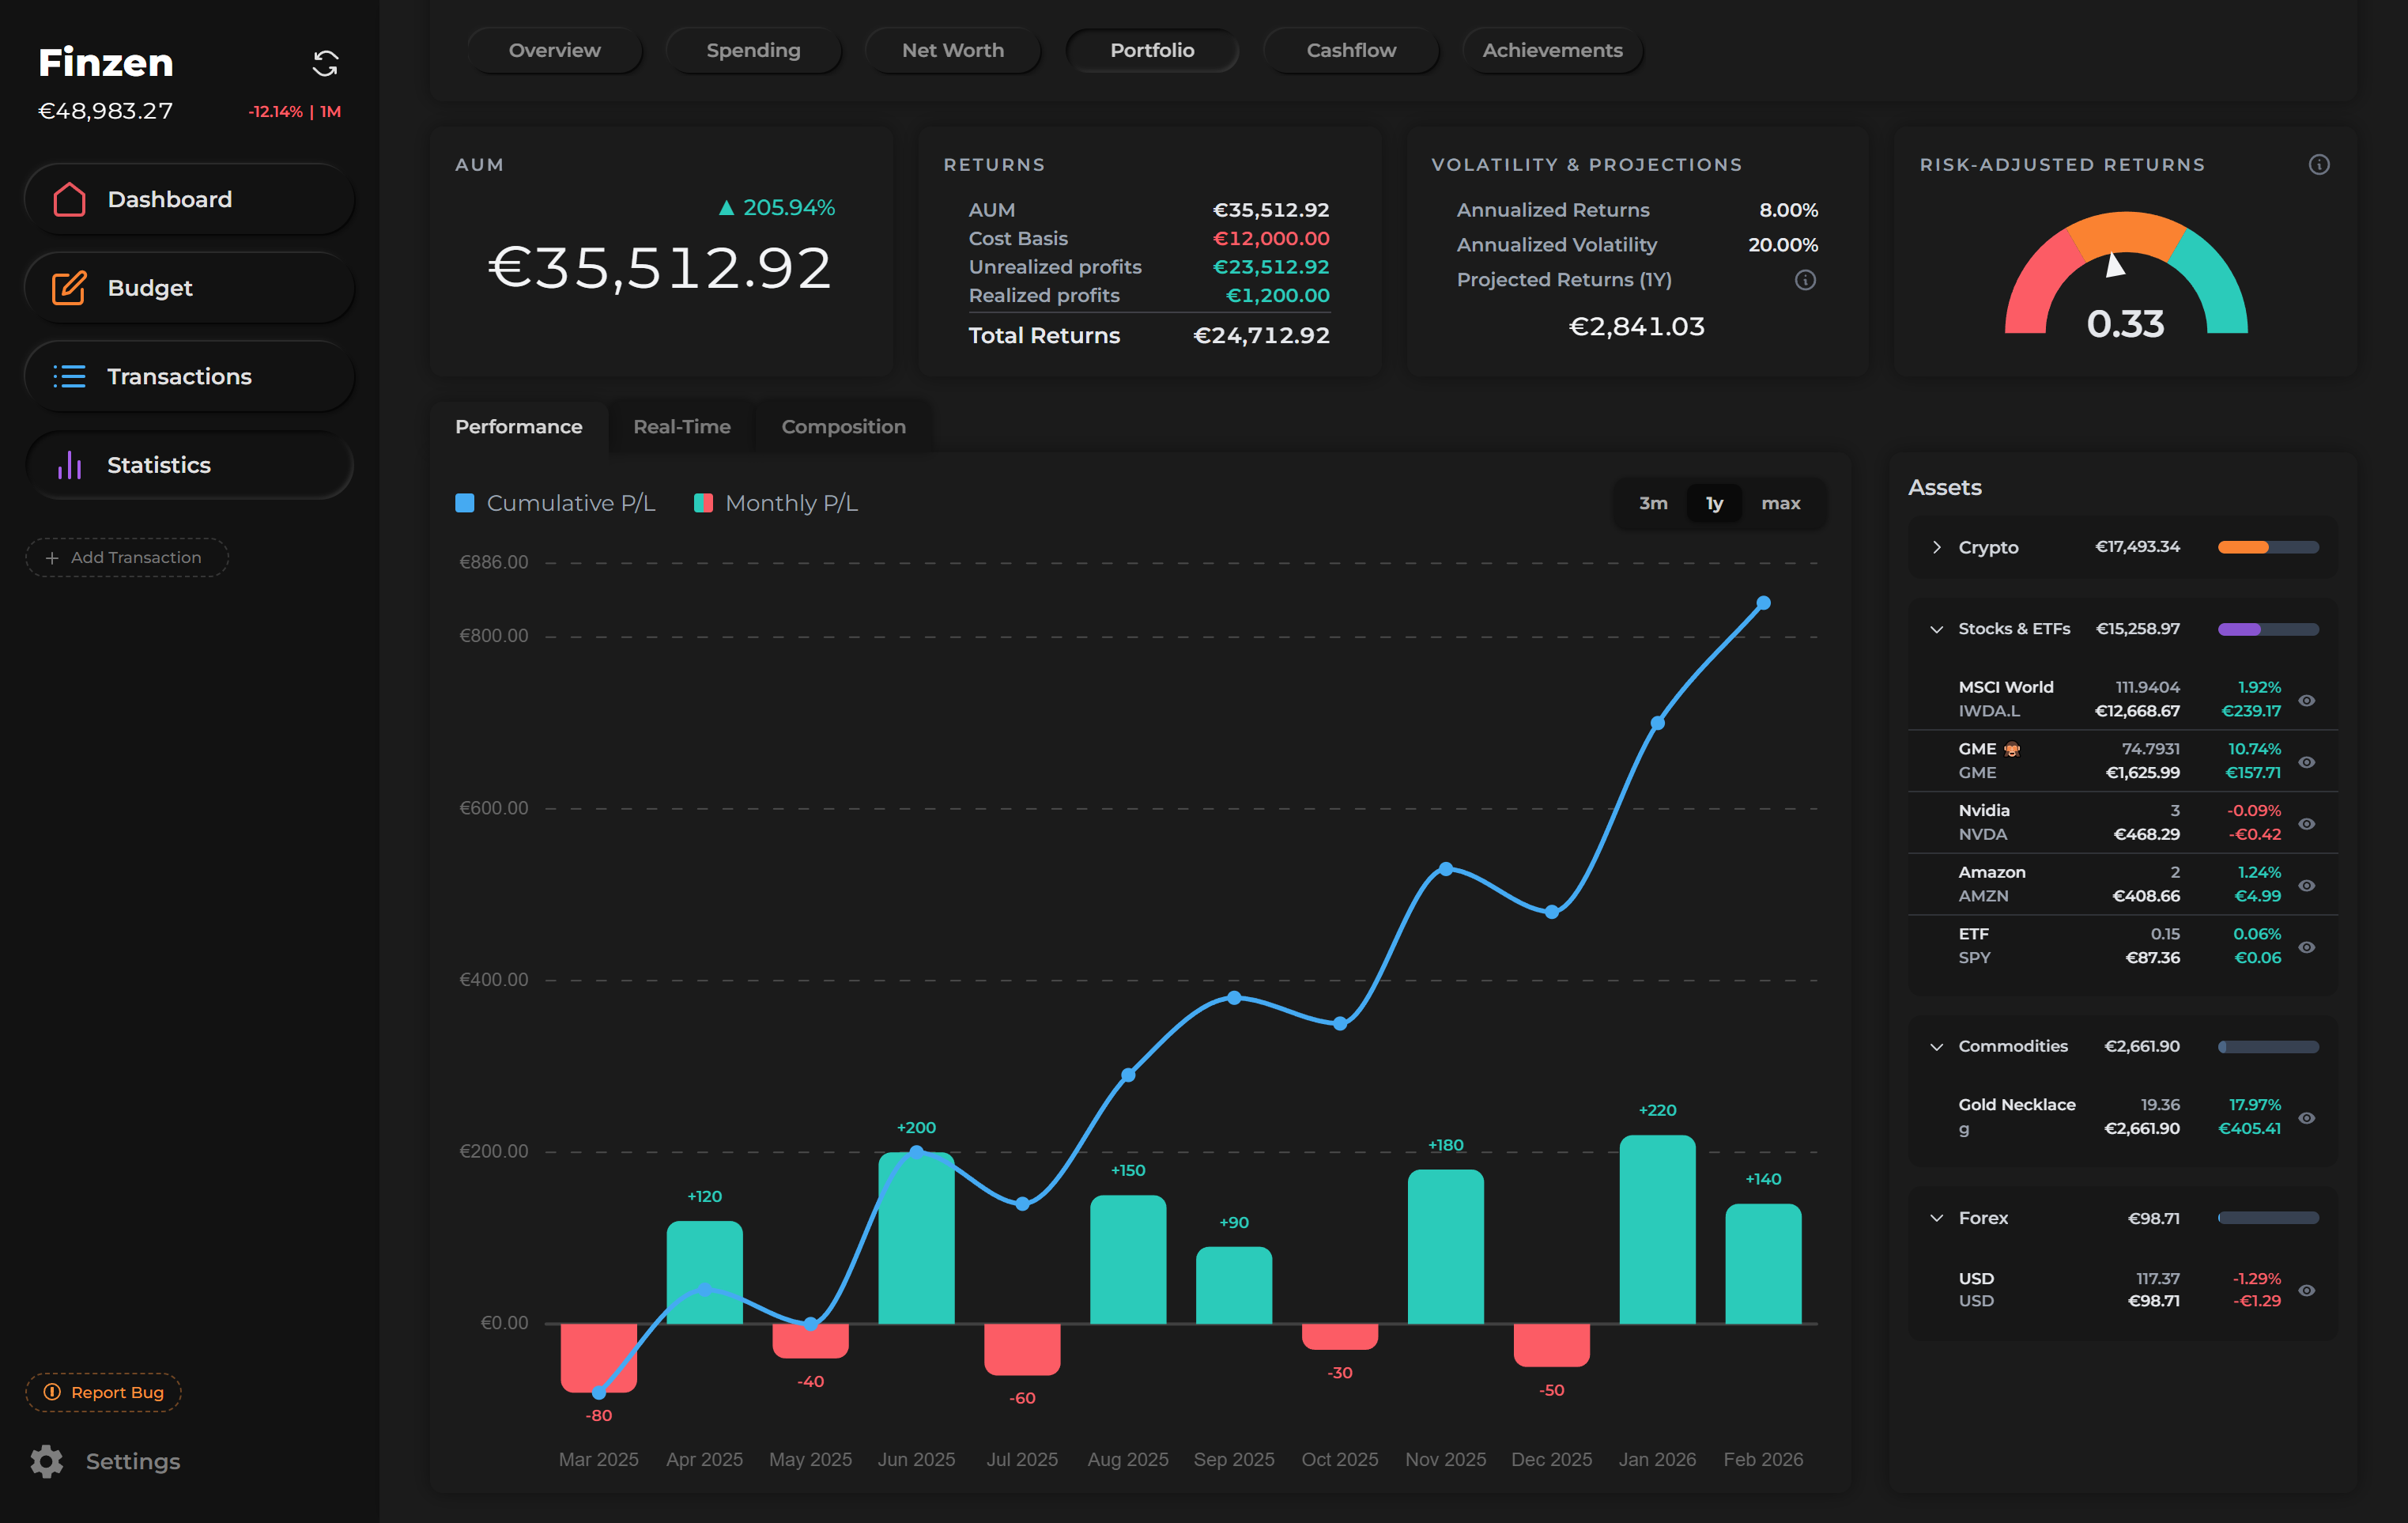
Asset sidebar
To the right of the chart, a list of your investments shows each holding's performance. Use the toggle at the top of the sidebar to switch between two views:
- By asset class — groups assets under their class (e.g., Stocks, Crypto, ETFs)
- By individual asset — shows every holding as its own row, ungrouped
For each asset, you can see:
- Holdings — how many units you hold, in the asset's native unit (shares, BTC, oz, etc.)
- Value — the current value converted to your primary currency
- P&L % — percentage gain or loss
- P&L Absolute — the exact gain or loss in your primary currency
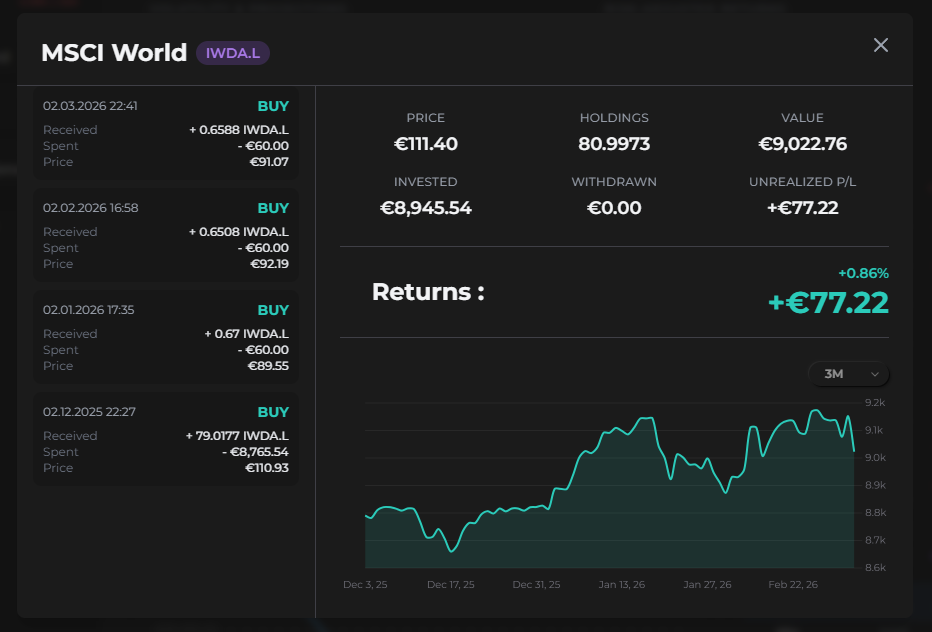
Asset detail modal
Click any asset in the sidebar to open its detail modal — a focused view of just that one holding.
The modal shows:
- All buy and sell transactions for that asset
- Current price (live)
- Holdings — units held and their current value
- Amount invested and amount withdrawn
- Unrealized P&L
- Returns — as both a percentage and an absolute value
- A chart showing how that asset has performed across different time frames
Real-Time
The Real-Time tab shows your total investment portfolio value as a live graph — identical in layout to the Real-Time tab in Net Worth, but scoped to investment accounts only.
Budget accounts and off-budget accounts are not included here.
Use the 1-hour or 24-hour view during market hours to watch your portfolio value move in near real time.
Composition
The Composition tab visualizes what your portfolio is made of — identical in layout to the Composition tab in Net Worth, but showing investment accounts only.
Toggle between two views:
- Account types — groups holdings by investment account
- Assets — shows each individual holding as its own slice of the donut, labeled by ticker or symbol
The sidebar alongside the donut ranks each item by its share of total portfolio value, making it easy to spot concentration at a glance.
The Composition view turns your portfolio into a picture. A single glance at the donut tells you more about your diversification than any list of numbers ever could.