Interface
Finzen's interface is built around four pages — each focused on a different part of your financial life. Here's a quick tour of where everything lives and what each area does.
The Sidebar
The sidebar is your main navigation. On desktop it runs along the left edge of the screen — persistent and always accessible. On mobile it collapses into a hamburger menu.
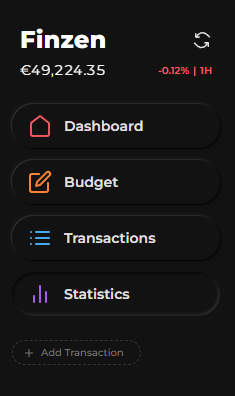
The four main pages:
| Page | What it's for |
|---|---|
| Dashboard | Your financial overview — net worth, accounts, asset allocation, and key stats |
| Budget | Your envelope budget — what's assigned and what's been spent this month |
| Transactions | Your full transaction log — add, filter, and manage entries |
| Statistics | Visual reports — spending trends, portfolio performance, net worth history, and more |
Sidebar Controls
At the top of the sidebar (desktop only), two controls sit alongside your real-time net worth:
- Refresh button — pulls the latest prices for your investment holdings, keeping your portfolio values and net worth current
- Change indicator — shows how your net worth has moved over a selected time frame. Click it to cycle through: 1H · 1D · 1M · 1Y · All time
At the very bottom of the sidebar are two utility buttons:
- Settings — opens the Settings page (currency, display preferences, light/dark mode, and more)
- Bug report — opens a short form where you can describe an issue and optionally attach a screenshot before submitting
On mobile, the sidebar collapses into a hamburger menu. On desktop, click the Finzen logo in the top left to collapse the sidebar to icons-only — giving you more screen space without losing your place.
Dashboard
The Dashboard is your financial home base — a real-time snapshot of your complete picture, all on one screen.
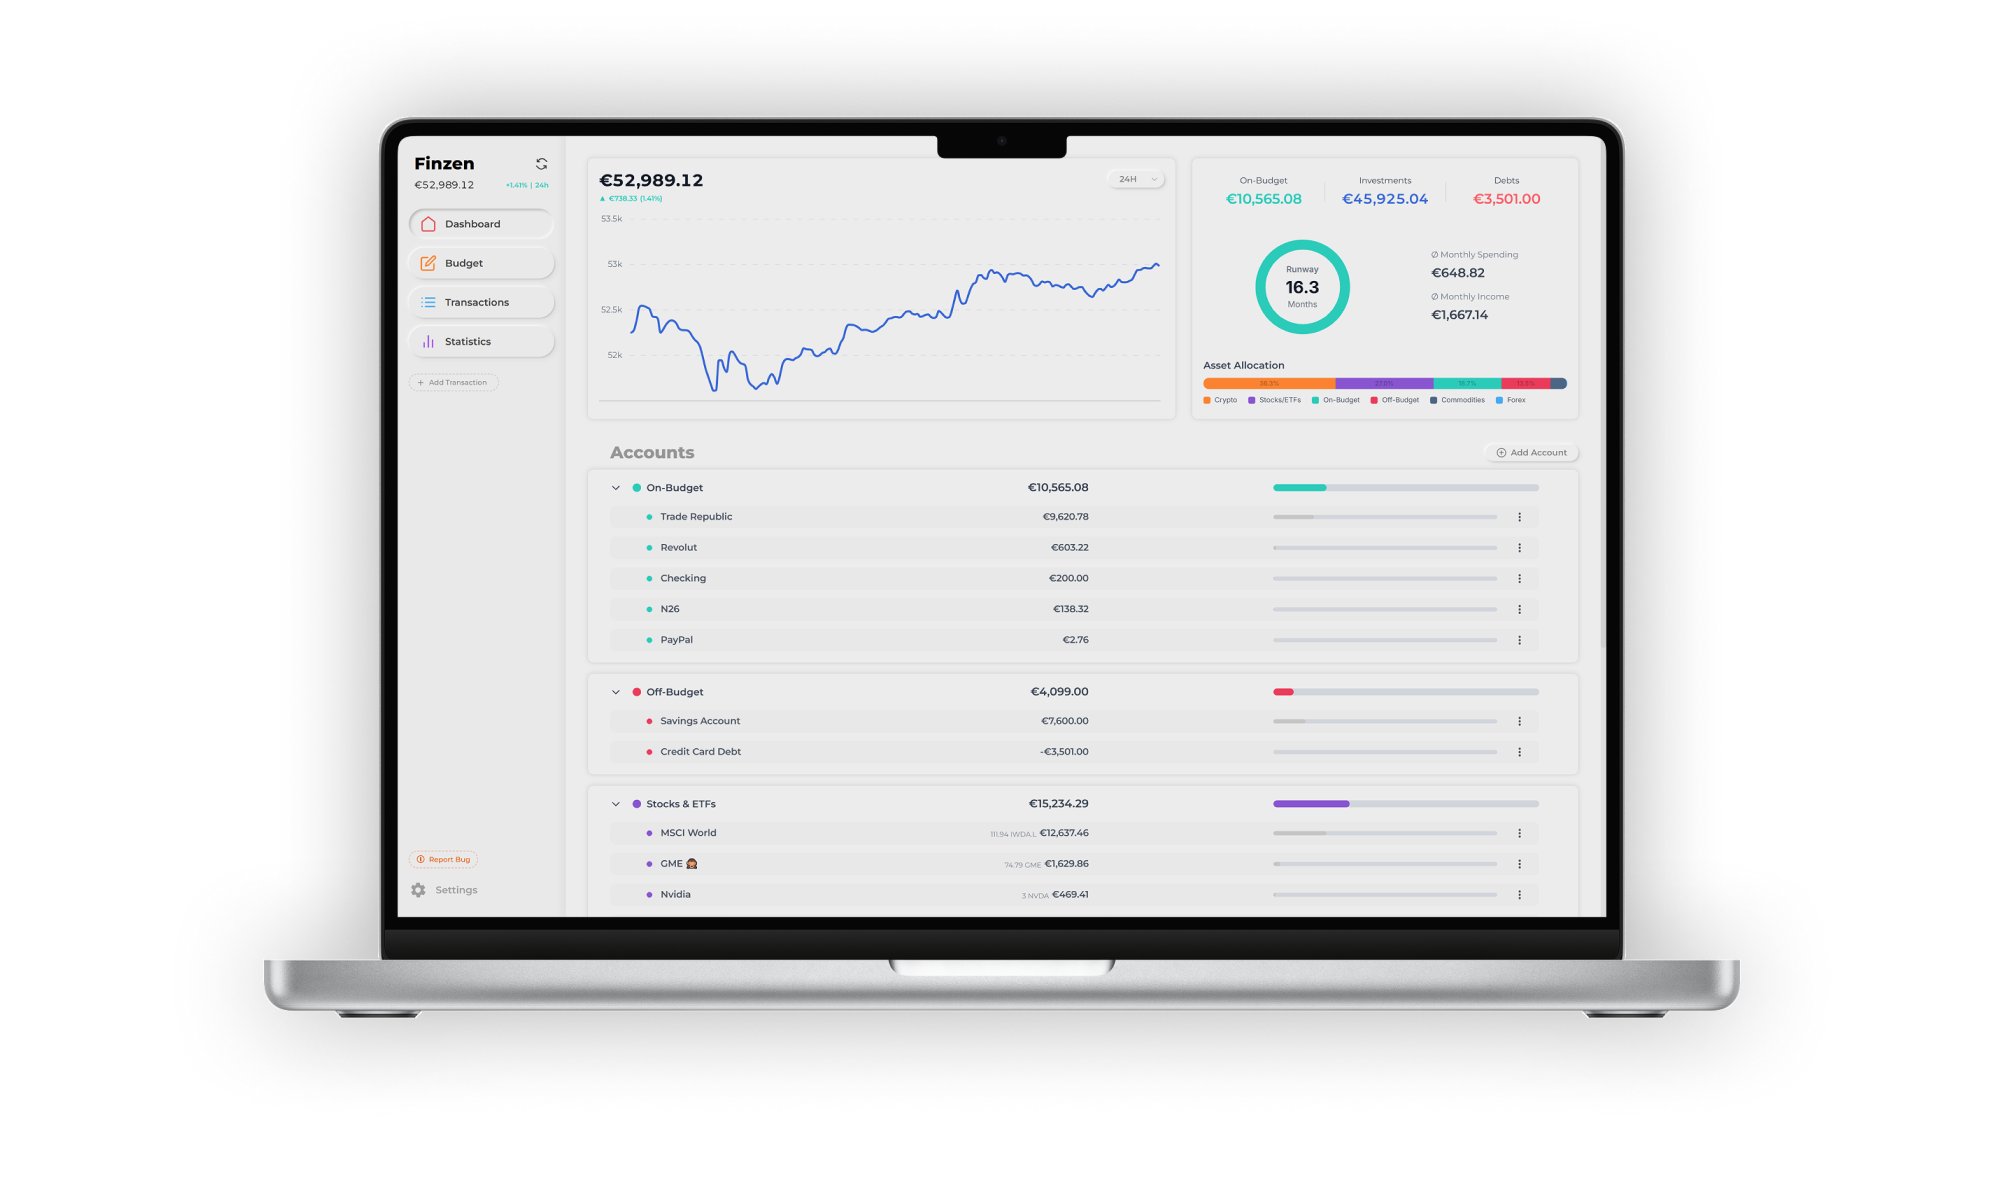
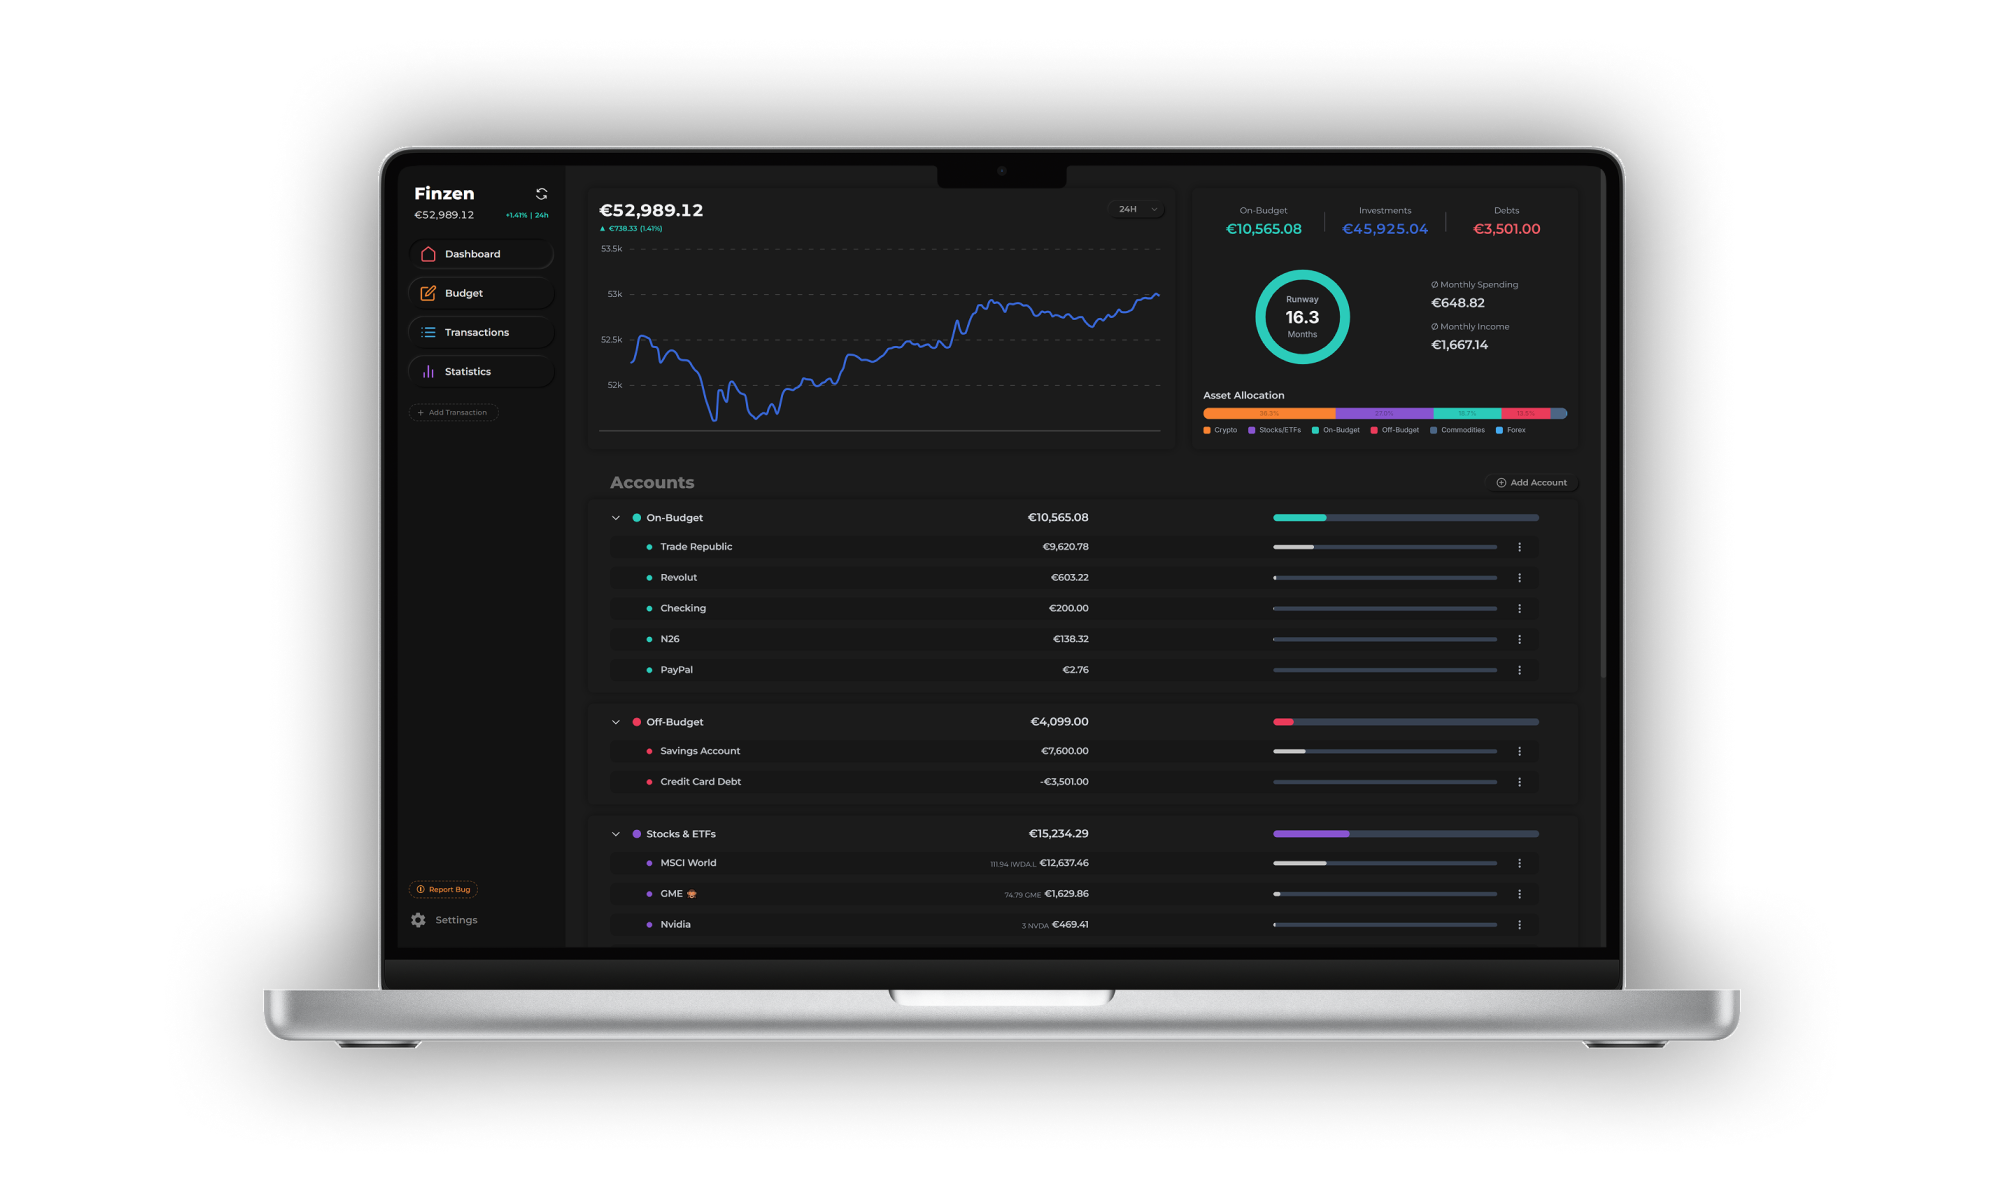
Net Worth Graph
At the top, a live graph shows your current net worth — all assets minus all liabilities, across every account. It updates as investment prices move.
Spending Statistics
To the right of the graph, three numbers give you a quick pulse check on your finances:
| Stat | What it shows |
|---|---|
| Avg. monthly spending | Your typical monthly outflow, averaged across every month since your first transaction. The current month counts too, weighted by how far into it you are — so it stays accurate early in the month instead of spiking. |
| Avg. monthly income | Same idea for money coming in. |
| Runway | How many months your current on-budget balance would last at your average spending rate. |
Runway answers: "If I stopped earning today, how long could I cover my expenses?" It's your current on-budget balance ÷ your average monthly spending. The longer the runway, the more cushion you have.
Because the current month is weighted by how much of it has elapsed, a big early-month payment (like rent on the 1st) won't temporarily crash your runway — it settles as the month fills in.
Asset Allocation Bar
A visual breakdown of how your wealth is spread across asset classes — stocks, ETFs, crypto, on-budget cash, commodities, forex, and more. Each segment is sized by percentage of total net worth, so you can see your full allocation at a glance.
Accounts List
At the bottom of the Dashboard, your accounts are grouped into three sections:
- On-budget funds — everyday spending accounts (checking, cash, credit cards)
- Off-budget — savings accounts, debts, and liabilities (loans, mortgages) tracked for net worth but outside the budget
- Investments — brokerage and wallet accounts holding stocks, ETFs, crypto, forex, physical commodities, and more — with their current market values
Click Add account to add a new account directly from the Dashboard.
Budget
The Budget page is where you run your envelope budget. Spending categories are organized into master categories and subcategories — each subcategory shows how much you've assigned, a spending progress bar, and the amount remaining.
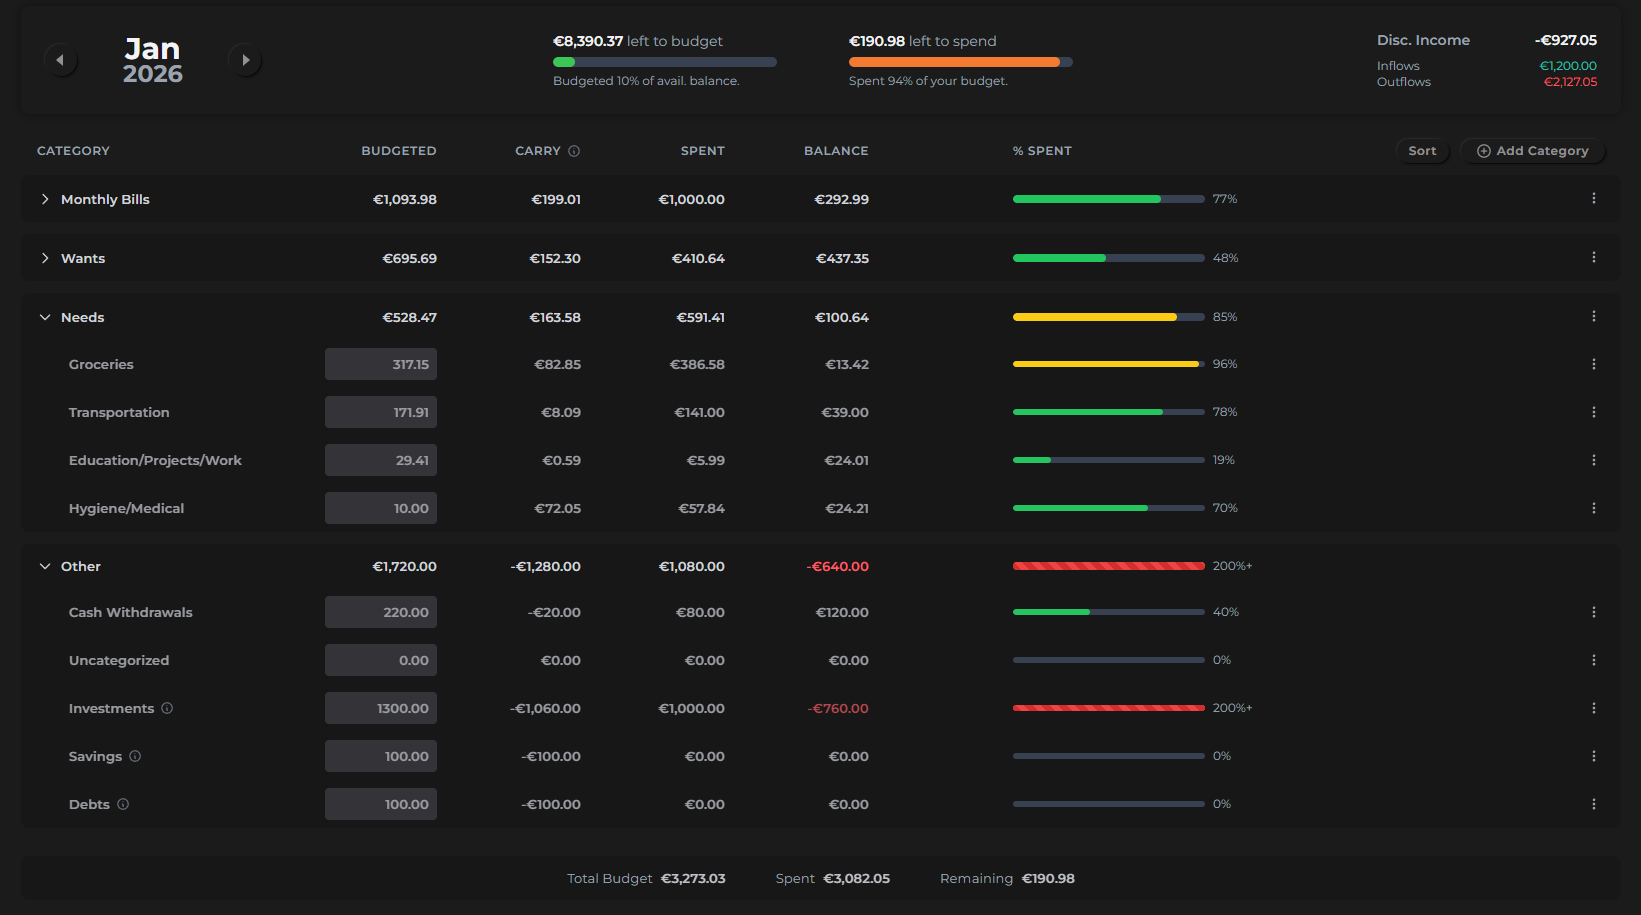
From this page you can:
- Set monthly amounts — assign a spending limit to each subcategory envelope
- Manage categories — add, rename, reorder, or archive master categories and subcategories
- Navigate between months — use the arrows in the top left to scroll back through previous months or plan ahead
You'll typically visit the Budget page at the start of each month to assign amounts, then check back throughout the month to track your spending. Full details in the Envelope Budgeting and Managing Your Budget sections.
Transactions
The Transactions page is a full log of every entry you've recorded — income, expenses, and transfers. You can star individual transactions to flag them, and filter the list by date, starred status, category, account, type, and more.

On desktop, an Add transaction button lets you add entries inline directly from this page. On mobile, the + button in the top-right corner opens the transaction form. Full details are in the Transactions section.
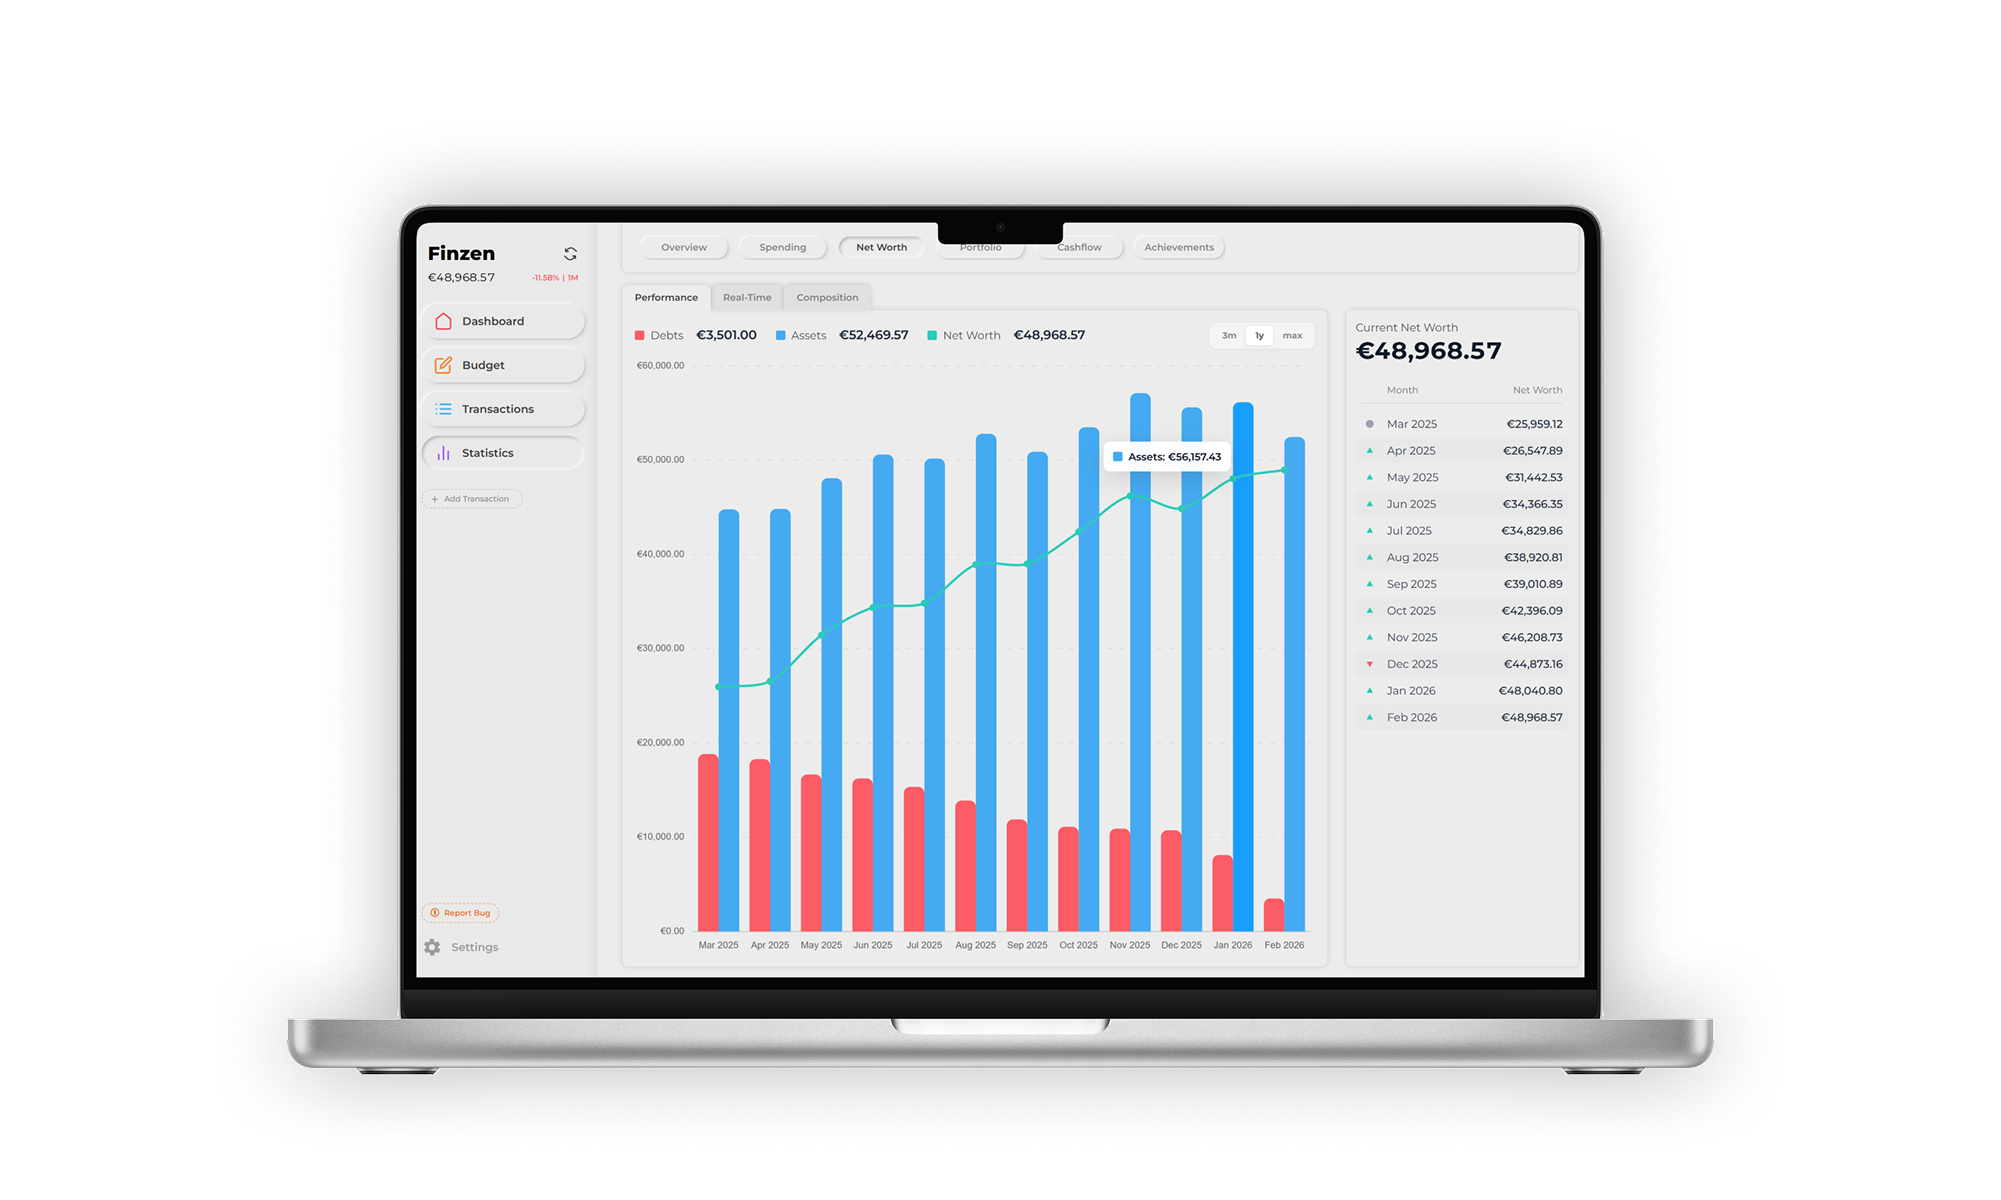
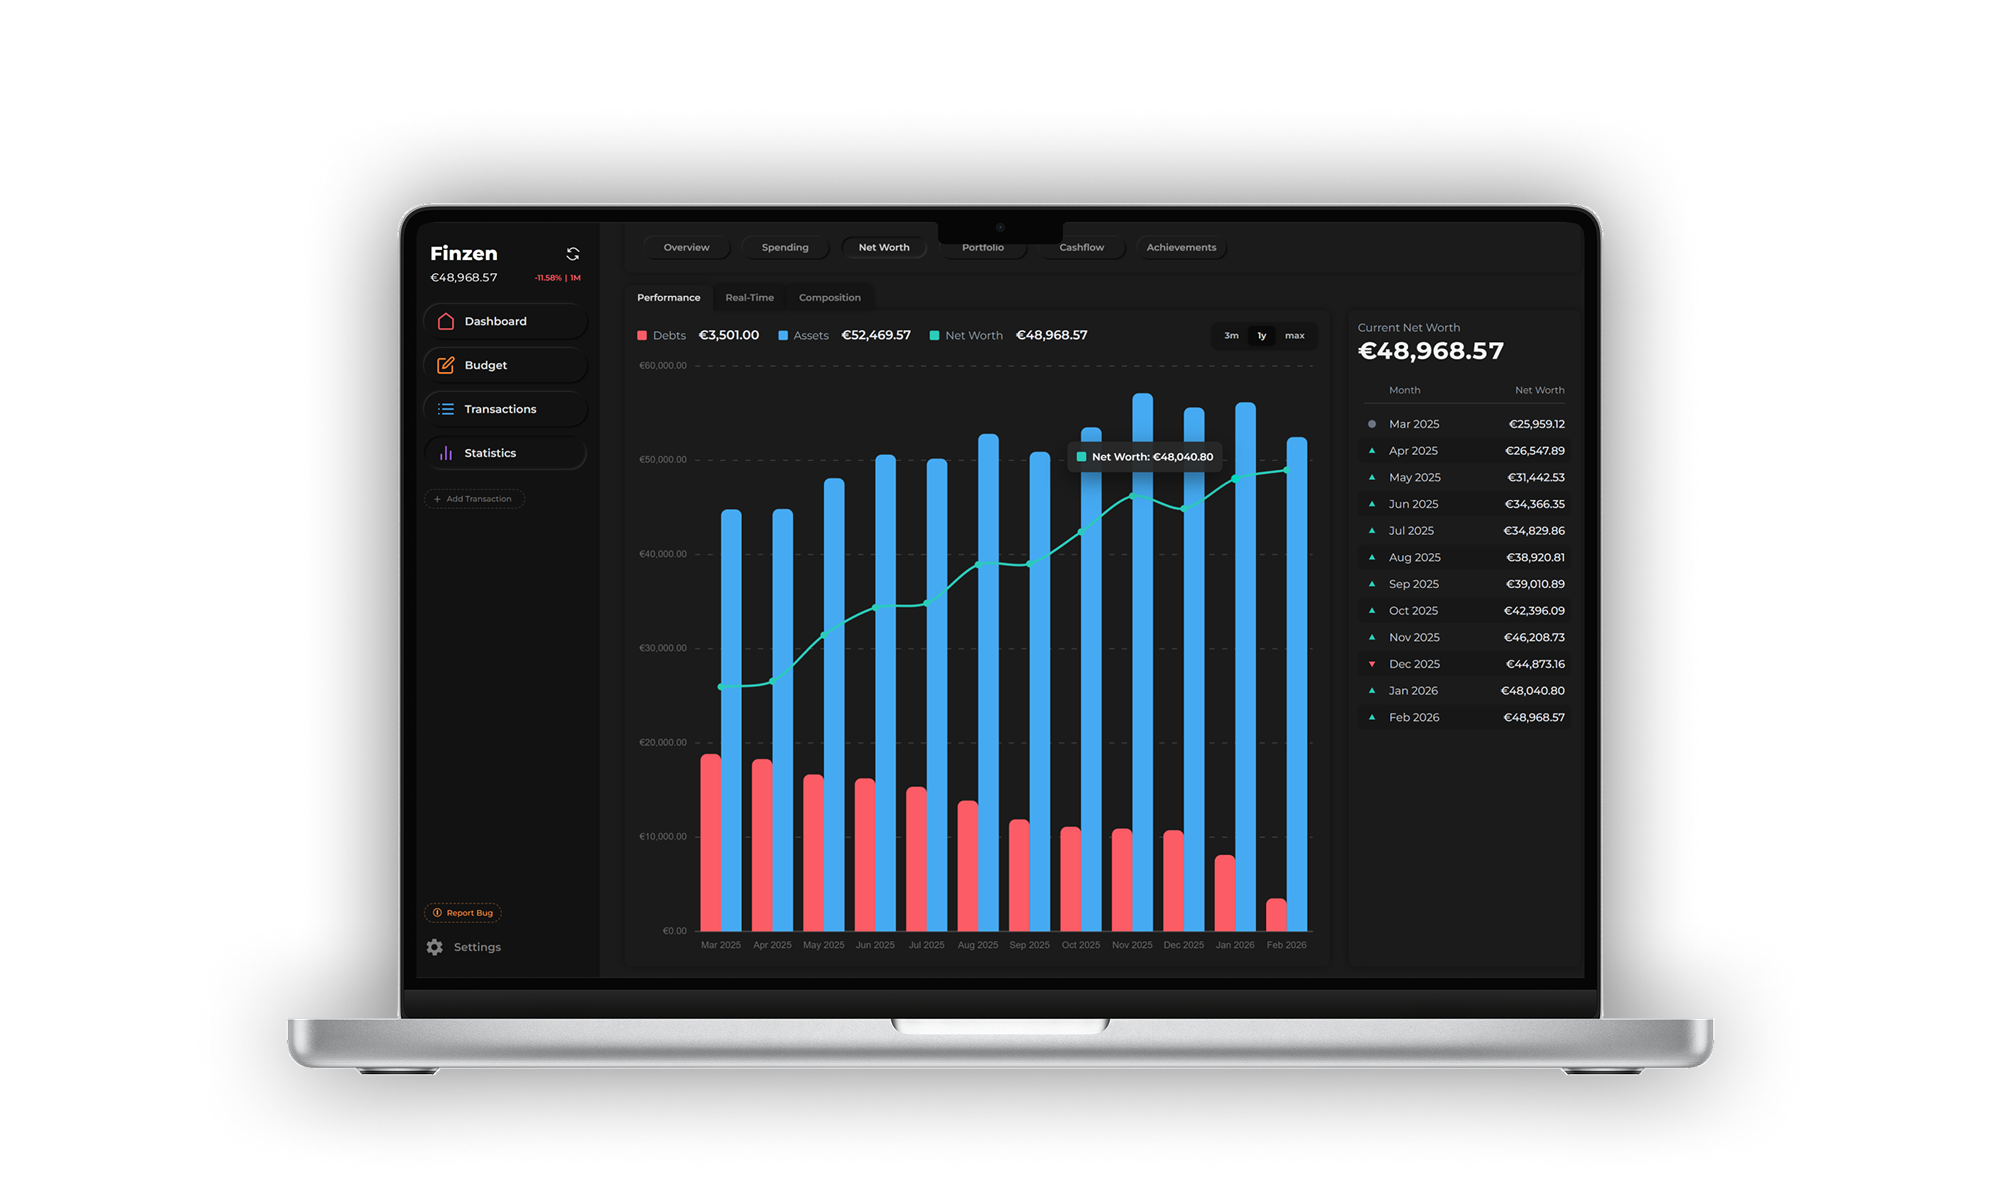
Statistics
The Statistics page is where all your logged data becomes visual insight. It's organized into tabs, each covering a different report:
| Tab | What it shows |
|---|---|
| Monthly Overview | A high-level health check for the current month |
| Spending | Spending breakdowns by category, tag, and trend |
| Net Worth | Your net worth trajectory over time |
| Portfolio | Investment performance, returns, risk metrics, and projections |
| Cash Flow | Money in vs. money out, including a Sankey flow diagram |
| Achievements | Financial milestones and goals you've hit |
Each report is covered in depth in the Statistics section.
Every transaction you log and every budget amount you set feeds directly into these reports. The habit creates the data — the data tells the story.
Where to Go Next
- Adding Accounts — Add and manage your bank accounts, investment accounts, and debts
- Transactions — Learn how to log and organize your daily transactions
- Envelope Budgeting — Understand the budgeting method powering Finzen's budget
- Statistics — A deep dive into every tab on the Statistics page